Solar System Geometry Index (SSGI)
updated 9 April 2025
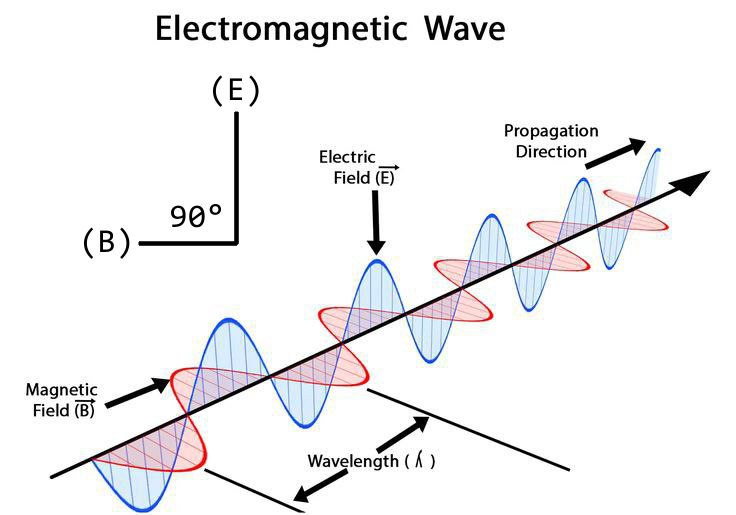
The Solar System Geomtry Index (SSGI) is the computation of a dataset based on values given to specific geometry between certain planets, the Moon and the Sun within a specific time-frame. This geometry is based on harmonics of the 90° property of the electromagnetic wave, i.e. 0°, 45°, 90° and 135°.
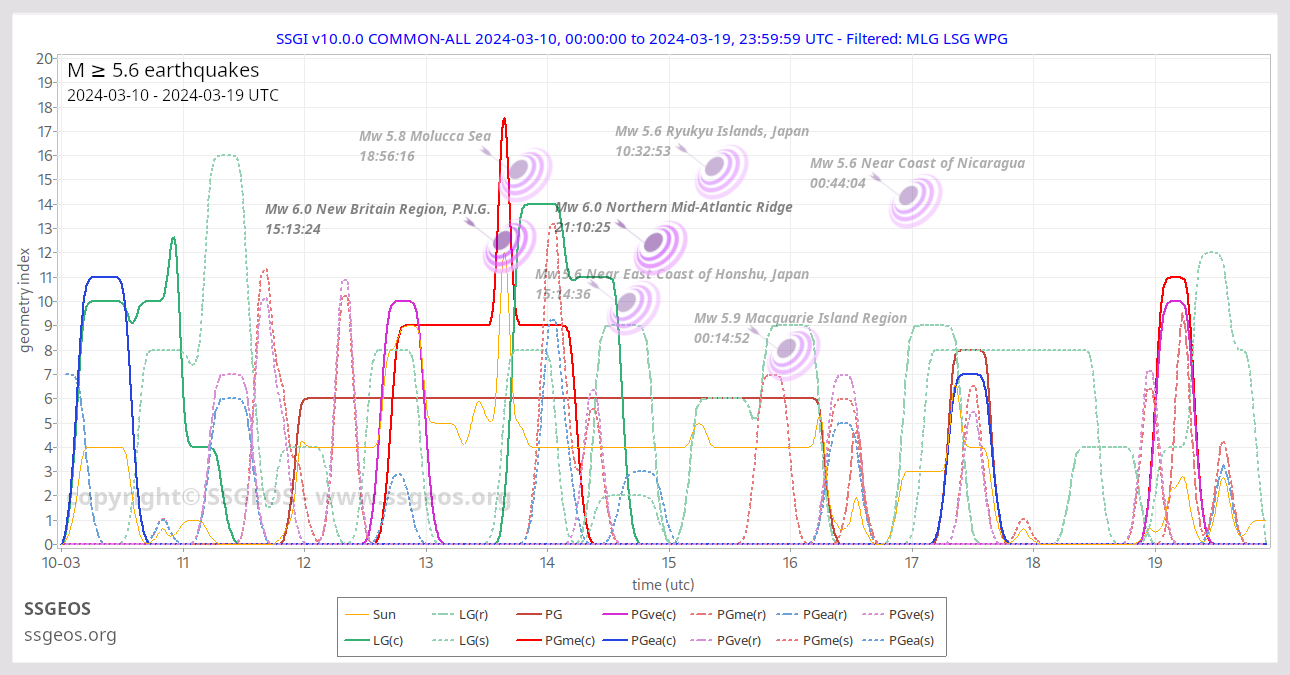
The geometry is depicted on the SSGI COMMON graph as a red (Mercury), purple (Venus), blue (Earth) or green (Moon) peak, whereby solid lines are conjunctions (c = 0°, 180°), dashed lines are right angles (r = 90°) and dotted lines are semi-right angles (s = 45°, 135°). The range of planetary peaks is defined by a ~0.20° tolerance and lunar peaks by a ~3.0° tolerance because of the Moon's higher orbital velocity. Stronger electromagnetic force occurs when indicated geometry converges in time, which typically results in short-term clusters of earthquakes with magnitude ≥ 5.5. It explains the phenomenon of temporal clustering of stronger earthquakes (not to confuse with spacial clustering). See also Geometry and Dynamics of the Solar System for more information about the geometry emphasized in our models.
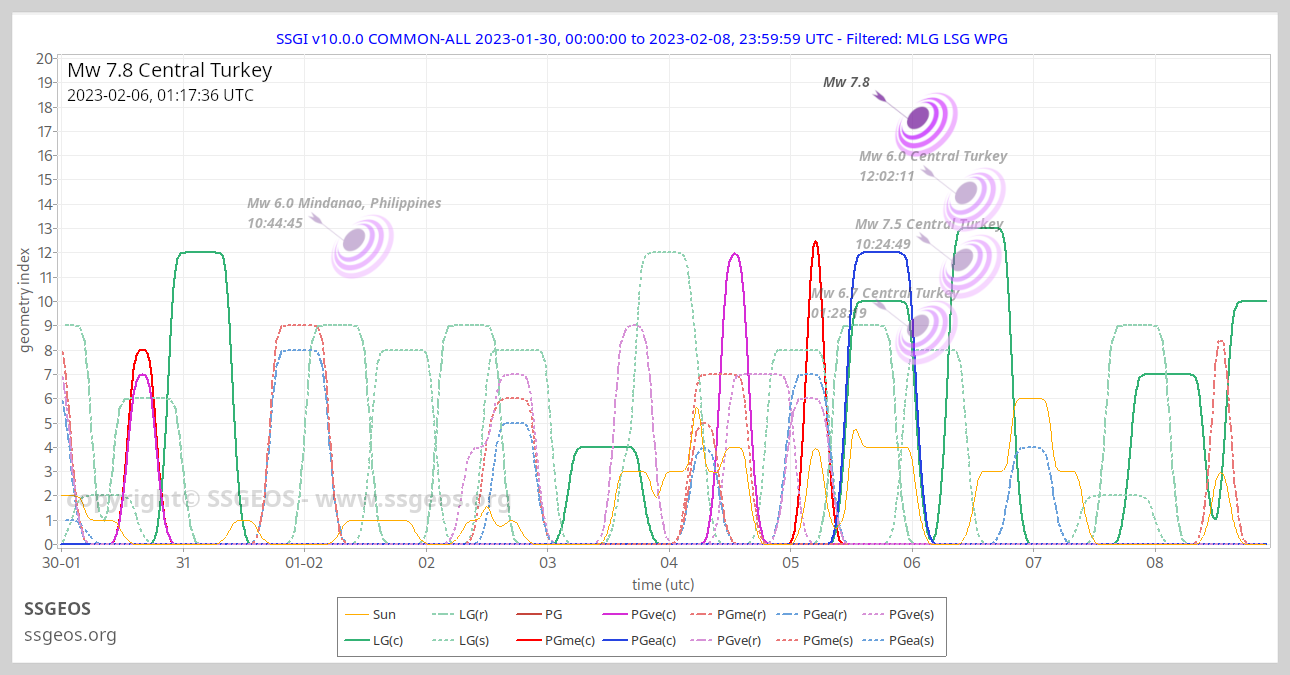
SSGI COMMON graph of Mw 7.8 and Mw 7.5 earthquakes on 6 February 2023 in Central Turkey. Note the near convergence of planetary conjunctions with Venus (purple), Mercury (red) and Full Moon (blue) on 4-5 February.
Models
There are currently three SSGI models in use: 1.'COMMON' emphasizes interpreted critical planetary and lunar geometry based on long-time observations. 2.'SUM' displays a categorized sum of default critical geometry between the planets. 3.'DETAILED' shows the default critical geometry of each planet, the Sun and the Moon.
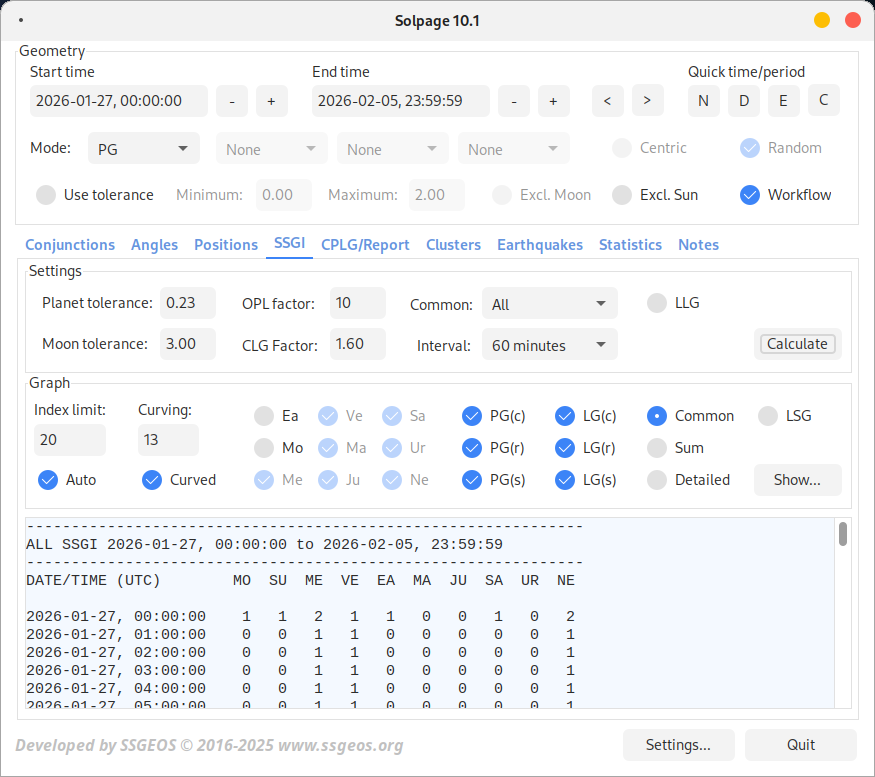
SSGI computation interface in Solpage
Development
After several years of observation and research, it became clear that some planetary and lunar geometry in the Solar System clearly tends to cause a seismic increase, while other geometry does not. From these observations a model was derived and added as an algorithm to the software program Solpage.
Development of SSGI started in July 2017. A basic algorithm was completed within two weeks. Since then, it has been revised and extended several times. The algorithm has been tested on large earthquakes in the past and shows obvious peaks — typically a convergence of critical planetary (PG) and lunar (LG) geometry — days before a large earthquake occurred.
In August 2021, with Solpage version 7.4, the SSGI COMMON graph has been revised. Instead of red peaks for all critical planetary geometry (PG), different colors are now used to mark geometry involving Mercury (PGme), Venus (PGve) and other planets (PG). Visualization of the involvement of Mercury and Venus is important, as convergence of critical planetary geometry with these two planets account for most of the major earthquakes. This conclusion is based on nine years of research.
In the course of 2022 critical geometry has been categorized into conjunctions (c), right-angles (r) and semi-right angles (s) (SSGI version 7.8.2.317). Extensive research has shown that this geometry, in particualar with Mercury, Venus and the Moon, has a strong relationship with stronger (Mw ≥ 5.6) earthquakes and with their tendency to cluster.
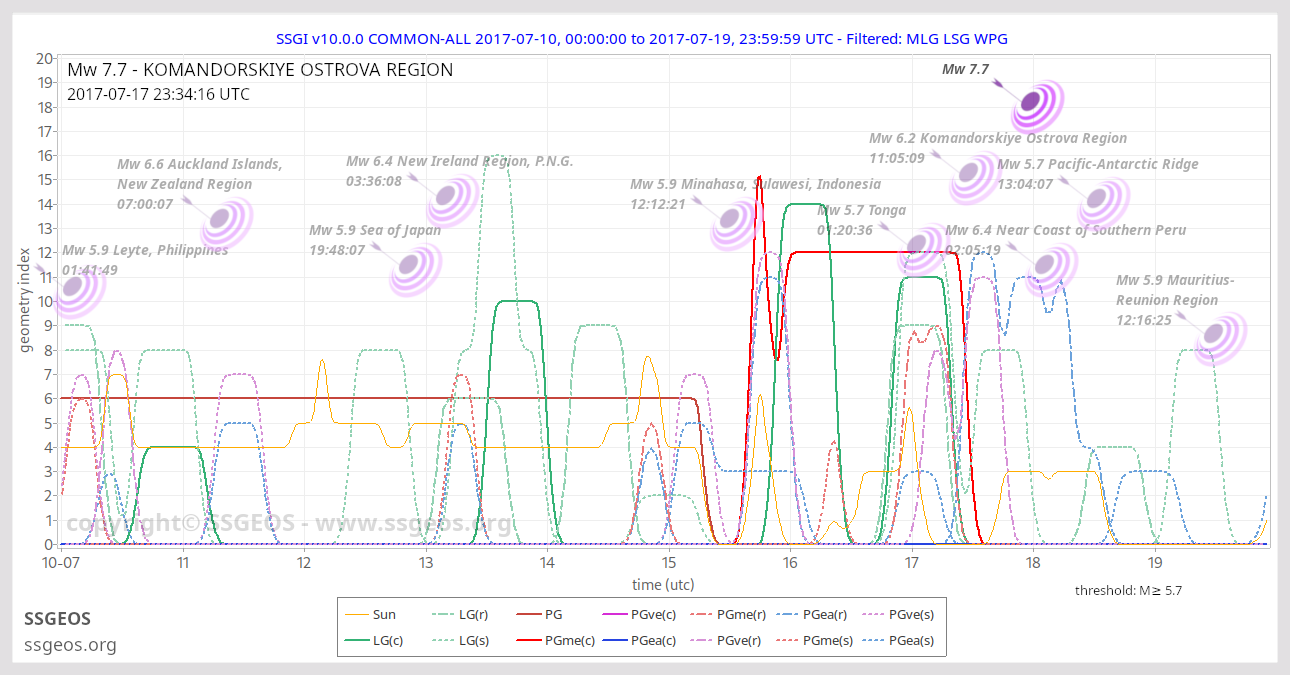
With Solpage version 9.2 in March 2024, the COMMON graph depicts the involvement of Earth (PGea) with blue lines. This modification was applied after analysis of planetary geometry before the major earthquake in Southern Xinjiang, China revealed a pair of right angles with Earth and Venus and associated clustering of strong tremors in the preceding days. Compare with the Komandorskiye Ostrova example above.
With Solpage version 9.4.0 (SSGI version 9.1.0) in June 2024, lunar conjunctions involving outer planets (Mars..Neptune) are more emphasized. For example, lunar conjunctions with Jupiter were set to index 10, while lunar conjunctions with Saturn were set to index 9. The new index for this geometry is now 14 and 13 respectively. Reason for this SSGI modification was te magnitude 7.2 earthquake in Peru on 28 June 2024, which occurred after a near convergence of planetary conjunctions with Venus and Mercury on 22-23 June, followed by the next lunar conjunction, which was with Saturn on the 27th.
In 2025 version 10 of Solpage and SSGI introduced curved geometry representations for each model. This is a significant change compared to the familiar straight peaks that have characterized SSGI since its introduction in 2017.
